LunarSite: An end-to-end ML pipeline for lunar south pole landing site selection
Sim-to-real terrain segmentation, fine-tuned crater detection, PSR-aware XGBoost site scoring, and calibrated uncertainty — validated against NASA’s Artemis III shortlist and real ShadowCam imagery at Cabeus.
LunarSite is a finished three-stage ML pipeline that ranks candidate landing sites on the lunar south pole. Stage 2 segments terrain (test mIoU 0.8456); Stage 1 finds craters on real LOLA DEM (recall 0.372 after a fine-tune that closed a 7× sim-to-real gap); Stage 3 ranks 315,034 cells with PSR-aware features and SHAP explainability. The top 1,000 cells overlap 5 of NASA’s 9 Artemis III candidate regions, and a calibrated MC Dropout variant flags out-of-distribution inputs with 4.7× higher mutual information than in-domain validation. Cross-instrument validation against ShadowCam at Cabeus / LCROSS shows 81–85 % agreement on the deepest-shadow regions.
Live demo: lunarsite.streamlit.app
Code: github.com/AlanSEncinas/LunarSite
Trained weights: kaggle.com/datasets/encinas88/lunarsite-weights
Author: Alan Scott Encinas (solo developer)
Why this exists
In March 2025, Intuitive Machines’ IM-2 lander reached the lunar south pole and crashed. The post-mortem pointed at the same things every south-pole mission has had to wrestle with: extreme low-angle illumination, kilometre-scale shadows, terrain relief unlike anything seen at the equator, and a deterministic flight algorithm (NASA’s SPLICE) that had been built for an environment more cooperative than the actual surface.
The south pole is the highest-stakes landing region in modern spaceflight. It’s where the water ice is, it’s where Artemis III is going, and it’s where the next decade of commercial lunar landings will be aimed. It’s also the region where classical computer-vision pipelines age the worst: most of the ground is shadowed for most of the year, the few illuminated peaks are surrounded by craters with kilometre-deep relief, and the geometry that worked at the Apollo equatorial sites simply doesn’t generalise.
LunarSite is what I’d build if I were starting from a blank page on the pre-mission side of that problem — not the real-time descent algorithm, but the screening tool that rules out the obviously hostile cells and surfaces the few that are worth a closer human look. It’s an attempt to fill the gap between NASA’s deterministic flight system and the academic ML literature on lunar terrain analysis, both of which exist but rarely meet in the middle.
The whole project is solo, open source under MIT, and built end-to-end — data download to live demo — on a single laptop with help from Kaggle’s free P100/T4 GPUs. Nothing in it is novel research individually; the contribution is that all the pieces talk to each other and validate against an independent benchmark (NASA’s 9 Artemis III candidate regions).
Pipeline at a glance
Three stages feed into a single ranking output. They were built independently and integrated last:
- Stage 2 — Terrain Segmentation: a U-Net + ResNet-34 classifier that takes RGB lunar imagery (synthetic or real) and labels every pixel as
background,small_rocks,large_rocks, orsky. Trained exclusively on 9,766 synthetic Unreal Engine scenes; transfers to real moon photography with no domain adaptation. - Stage 1 — Crater Detection: a binary U-Net on 256×256 LOLA DEM tiles. Trained on DeepMoon synthetic DEMs (Silburt 2019), then fine-tuned on real LOLA south pole tiles to close a 7× sim-to-real gap.
- Stage 3 — XGBoost Site Scorer: 29 features over 315,034 one-km grid cells across 80°S–90°S. Rule-based pseudo-labels from NASA’s CASSA thresholds (slope ≤5°, illumination ≥33%, Earth visibility ≥50%), gradient-boosted to a soft score the hard rule alone can’t produce, with SHAP explainability and per-cell PSR exposure.
Stage 2 also has a calibrated MC Dropout variant for epistemic uncertainty — the “does the model know what it’s looking at?” signal. Cross-instrument PSR validation uses real ShadowCam imagery at Cabeus / LCROSS as an external check on the PGDA-derived shadow features.
Headline numbers, all evaluated on held-out data:
| Stage | What it does | Key metric |
|---|---|---|
| Stage 2 | Terrain segmentation | Test mIoU 0.8456 |
| Stage 2 (MC Dropout) | Calibrated uncertainty | ECE 0.0072 |
| Stage 1 | Crater rim detection on LOLA | Recall 0.372 (+140 % vs v1) |
| Stage 3 | XGBoost site ranking | 5/9 Artemis III regions matched |
| PSR validation | PGDA vs ShadowCam at Cabeus | 81–85 % agreement |
The next four sections walk through the most interesting decisions and the results that came out of them. The full technical detail is in the repo; this is the “what would I tell a competent ML engineer about how this was built and why” version.
Stage 2: synthetic Unreal Engine to real moon photographs
The most surprising result in the whole project is the easiest one to demonstrate: a model trained exclusively on 9,766 synthetic Unreal Engine lunar scenes generalises to real moon photography with no domain adaptation. Not perfectly — we’ll get to the failure mode — but well enough that a stranger looking at the demo can’t reliably tell which predictions are on training-distribution data vs real Apollo / rover photographs.
The dataset is Romain Pessia’s Artificial Lunar Rocky Landscape Dataset on Kaggle (CC BY 4.0): 9,766 procedurally-generated UE5 lunar surface renders at 480×480, with paired pixel-space ground-truth masks for four classes — background, small_rocks, large_rocks, sky. The dataset also ships 72 real moon photographs (no labels) which I held out as a sim-to-real eval set.
v1 config (the production winner): U-Net + ResNet-34 encoder (ImageNet-pretrained), Dice + Cross-Entropy loss with equal weighting, Adam optimiser with cosine annealing from lr 1e-4 to 1e-6, 50 epochs at 480×480, batch 16, fixed 80/10/10 split with split_seed=42. Lunar-specific augmentations: shadow rotation, extreme contrast, Hapke BRDF perturbation, synthetic crater overlay. Training ran on Kaggle’s free P100 in about 4 hours.
| Result | Value |
|---|---|
| Best validation mIoU (epoch 49/50) | 0.8357 |
| Test mIoU (standard inference) | 0.8425 |
| Test mIoU (4-flip TTA) | 0.8456 |
| 5-seed deep ensemble (test, TTA) | 0.8445 ± 0.0013 |
I also trained a v2 with a heavier ResNet-50 encoder, FocalDiceLoss, and inverse-frequency class weighting — on paper, all the right knobs to push the rock classes (which are minority and matter most for landing-site safety). It lost. Test mIoU 0.8429 with the same flip TTA, 0.0027 below v1. Multi-scale TTA on top of v2 also degraded performance. v2 is on Kaggle as a documented negative ablation: useful science is occasionally just “the simpler thing won, here’s the data so nobody else has to redo this.”
The real test is sim-to-real. Run the v1 model with flip TTA on 36 real moon photographs (the held-out set) and look at the per-class coverage distribution against training-set distribution:
| Class | Synthetic training distribution | Real moon predictions |
|---|---|---|
| background | 76 % | 75 % |
| small_rocks | 19 % | 19 % |
| large_rocks & sky | ~5 % combined | ~6 % combined |
Class balance is preserved within a percentage point. Predictions on real photographs aren’t hallucinating a different scene composition — the model is doing roughly the same kind of work it did at training time. Visually, the failure mode is consistent and identifiable: very bright sun-lit boulders sometimes get classified as sky. The synthetic training set has bright, uniform sky in every frame, so the model learned a “bright + uniform = sky” shortcut that fires on a few real-world boulders. This is documented in the demo and visible in the contact sheet.
I also ran the v1 segmenter zero-shot on real NASA orbital south pole imagery — LRO context-camera and similar — and got coherent (if not high-quality) results: the model knows that south pole orbital views aren’t the same kind of scene as the synthetic surface renders, but its class distribution shifts in plausible directions (much more background, fewer rocks, less sky). Streamlit demo has a dedicated section showing this.
Stage 1: closing a 7× sim-to-real gap on real LOLA south pole
Stage 2 transferred from synthetic to real cleanly. Stage 1 didn’t. The DeepMoon-trained crater detector failed badly on real LOLA south pole DEM, and the gap between synthetic-eval and real-eval performance was the most instructive finding of the project.
Stage 1 is a binary segmentation U-Net (also ResNet-34) that takes a single-channel DEM tile and predicts crater rim pixels. Training data is DeepMoon (Silburt et al. 2019, Zenodo 1133969): about 30,000 256×256 synthetic-DEM tiles at 118 m/px, derived from a merged LRO LOLA + Kaguya elevation model with procedurally generated craters. Pixel-space ring masks paired with each tile.
v1 config: SMP Unet("resnet34"), 1-channel input, 1-class binary output, Dice + BCE loss (50/50), Adam at lr 1e-4, 40 epochs at 256×256 batch 16. Kaggle P100. Internal 80/10/10 split because Kaggle’s 20 GB working directory couldn’t fit all three DeepMoon HDF5 files simultaneously — an annoyingly mundane infrastructure detail that ate a few hours.
| v1 (DeepMoon-only) results | Value |
|---|---|
| Best validation IoU on DeepMoon (epoch 35/40) | 0.306 |
| Test IoU on DeepMoon (flip TTA) | 0.327 |
| IoU on real LOLA south pole DEM (full 7,600×7,600 grid) | 0.111 |
| Recall on real LOLA south pole DEM | 0.155 |
0.155 recall means the model is missing 84 % of the actual craters in the Robbins ground-truth catalogue when run on real south pole DEM. That’s a hard fail. I’d expected some sim-to-real degradation given that DeepMoon’s synthetic craters have been procedurally generated and the south pole’s real terrain is much more chaotic, but a 7× recall drop ruled out anything Stage 3 might have done with this signal.
I ran a four-config × nine-threshold sweep before concluding that the gap wasn’t a preprocessing problem. Both per-tile and global normalisation, both 80 m/px and 118 m/px (DeepMoon native scale) resampling — each combination capped at IoU 0.111. This was a distribution-within-domain shift, not a modality shift. The model needed real LOLA examples.
v2 was the fix. I built a small fine-tuning HDF5 from the real LOLA 20 m/px south pole DEM (LDEM_80S_20MPP_ADJ.TIF) by resampling to 118 m/px (matching DeepMoon’s training scale) and tiling into 334 overlapping 256×256 patches. Crater rim circles from the Robbins 2018 catalogue (filtered to ≥3 km diameter) were rasterised as binary targets. The HDF5 is published on Kaggle as a companion dataset.
Fine-tune config: warm-started from v1 weights, 25 epochs at lr 1e-5 (deliberately slow, because we’re adapting an existing geometry, not learning from scratch), batch 8 due to small dataset size, on the local RTX 4070. The pre-fine-tune validation IoU on the new real-LOLA val set was 0.021 — literally the same disaster we saw on the full DEM eval. After 25 epochs, validation IoU climbed to 0.161. Best epoch was 22.
Re-evaluated on the same full 7,600×7,600 LOLA south pole DEM with flip TTA at threshold 0.25:
| Metric | v1 (DeepMoon only) | v2 (fine-tuned) |
|---|---|---|
| IoU | 0.111 | 0.162 (+46 %) |
| Dice | 0.200 | 0.279 |
| Recall | 0.155 | 0.372 (+140 %) |
| Precision | 0.282 | 0.224 |
IoU is computed against 1-pixel-wide Robbins rim masks on a 7,600×7,600 grid. Even a perfect detection that’s offset by a single pixel collapses the intersection. Recall (what fraction of real craters the model finds) is the operationally meaningful metric for landing-site hazard feature extraction. The +140 % v1→v2 jump on recall is the real result; the precision drop from 0.282 to 0.224 is an acceptable trade for an order-of-magnitude better real-world coverage.
Both v1 and v2 are on Kaggle. v2 is the production Stage 1 model used by scripts/run_pipeline.py end-to-end.
Stage 3: PSR-aware site scoring + Artemis III validation
Stage 3 is where the pipeline becomes the thing it’s for: a ranked list of candidate landing cells across the lunar south pole, with a learned score and SHAP explanations of what’s driving each.
The grid is 315,034 cells of 1 km × 1 km each, spanning 80°S to 90°S in polar stereographic projection (IAU:30135). For every cell I extract 29 features:
- LOLA topography (8): elevation mean / std / min / max, slope mean / std / min / max, computed from the LOLA 80 m/px south pole DEM and PGDA Product 90’s 20 m/px slope raster (auto-reprojected to the DEM grid).
- Crater density (4): crater_count, crater_coverage_pct, crater_mean_diameter_m, crater_max_diameter_m. Derived from Stage 1 v2 crater predictions.
- Illumination (4): avg_illumination_pct (sun visibility), illumination_min_pct (worst-spot illumination in cell), psr_fraction (fraction of pixels below the 0.5 % PSR threshold), earth_visibility_pct. From PGDA Product 69 (Mazarico 2011).
- Roughness + DEM error (8): mean / std / min / max of each. PGDA-derived.
- Cell coordinates (5): cell_id, lat, lon, x_m, y_m (polar stereographic).
Labels are rule-based, not learned. I use NASA’s CASSA thresholds — slope ≤ 5°, illumination ≥ 33 %, Earth visibility ≥ 50 % — to mark cells as “suitable” or “not.” That gives 419 suitable cells out of 315,034 (~0.13 %), severely imbalanced. XGBoost trains in 2.5 seconds with histogram tree method, depth 6, lr 0.05, 300 estimators. Test AUC 1.0 (which is exactly what should happen when XGBoost can perfectly recover a deterministic boolean rule from its inputs).
The point of training a classifier on a deterministic rule isn’t that the classifier “learns” the rule — it’s that XGBoost gives you a soft, calibrated score across all cells, including the 99.87 % that fail the binary rule. That score is what you rank on. Cells just below threshold (4.9° slope, 32 % illumination) get scored higher than cells far from threshold (15° slope, 0 % illumination). SHAP then explains which feature drove each cell’s score.
SHAP top-7 features by mean absolute attribution (sanity-check + signal):
| Rank | Feature | |SHAP| | Comment |
|---|---|---|---|
| 1 | earth_visibility_pct | 3.39 | CASSA rule input |
| 2 | slope_mean | 2.08 | CASSA rule input |
| 3 | avg_illumination_pct | 1.62 | CASSA rule input |
| 4 | elevation_std | 0.26 | Learned signal — CASSA doesn’t encode this |
| 5 | slope_max | 0.24 | Worst-spot in cell |
| 6 | slope_min | 0.16 | |
| 7 | illumination_min_pct | 0.16 | PSR-aware feature — catches partial PSRs the mean hides |
The top 3 are the CASSA rule inputs — correct, expected, sanity check passed. Then elevation_std shows up in 4th place: the model learned that a cell’s internal elevation variance matters even when its mean slope passes CASSA. A flat-mean cell with high elevation variance probably has a hidden ridge or pit. illumination_min_pct — the worst-spot illumination in the cell — lands at #7, capturing partial PSRs that the CASSA rule’s mean-illumination check misses by averaging.
Validation against NASA’s 9 Artemis III candidate regions
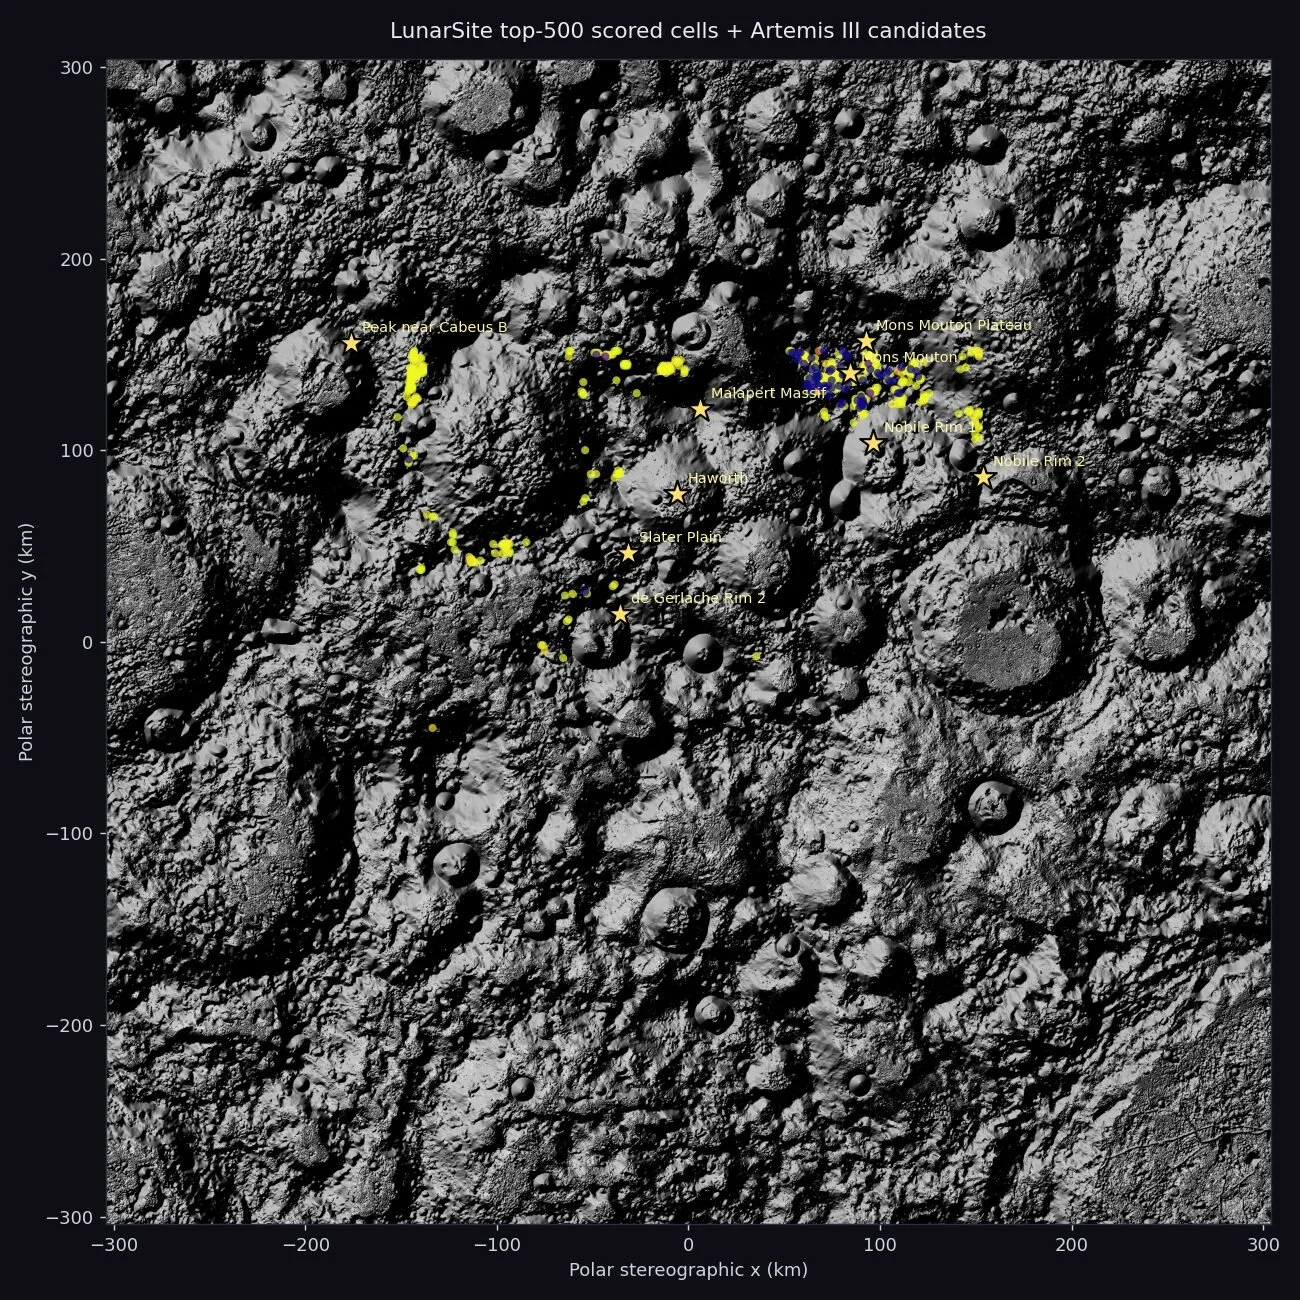
The hardest external check on a landing-site scorer is whether its ranking overlaps with an independent expert analysis. NASA published 9 Artemis III candidate regions (Cabeus B, Haworth, Malapert Massif, Mons Mouton Plateau, Mons Mouton, Nobile Rim 1, Nobile Rim 2, de Gerlache Rim 2, Slater Plain). I encoded their published centre coordinates and asked: how many of LunarSite’s top-N ranked cells fall within 15 km of any Artemis region centre?
| LunarSite top N | Regions matched (of 9) | Key matches |
|---|---|---|
| Top 100 | 2 | Mons Mouton (18 cells), Mouton Plateau (5) |
| Top 500 | 4 | + Nobile Rim 1, de Gerlache Rim 2 |
| Top 1000 | 5 | + Malapert Massif (closest 0.5 km from centre) |
5 of 9 NASA Artemis III candidate regions match LunarSite’s independent top-1000 ranking. The dominant cluster is Mons Mouton — the peak-of-eternal-light region NASA picked as the primary Artemis III candidate. All top-10 LunarSite cells sit at +4.5 to +4.9 km elevation in the Mons Mouton massif, with slopes 2.7–4.6°, illumination 35–40 %, and Earth visibility 60–85 %.
Haworth is correctly excluded — it’s a permanently shadowed crater that fails the CASSA ≥33 % illumination rule, and the scorer learned to deprioritise it. Cabeus B and Slater Plain don’t make the top 1000, which is a real disagreement with NASA’s shortlist; both regions are at or near the limits of what CASSA-style rule-based pseudo-labels can capture, and a more sophisticated label set would probably surface them.
One more PSR-specific check: of the top 100 LunarSite-ranked cells, 0 contain any PSR ground (defined as < 0.5 % average illumination). The scorer is avoiding shadows entirely without being told to as a hard constraint — it learned the avoidance behaviour from the CASSA pseudo-labels and the PSR-aware features, and it generalises beyond the rule’s mean-illumination threshold.
Knowing what you don’t know: MC Dropout calibration + Cabeus cross-validation
Layer 3 of the project is the part I’d care about most if a real lunar mission planner ever looked at LunarSite. A good landing-site scorer doesn’t just produce rankings — it tells you when its rankings are unreliable. Two pieces address this.
MC Dropout for calibrated epistemic uncertainty
The Stage 2 production segmenter has flip TTA for inference-time robustness, but no notion of when its prediction is reliable. To add that, I fine-tuned a dropout-equipped variant: 27 Dropout2d(p=0.1) modules injected after every ReLU in the U-Net + ResNet-34, warm-started from best_resnet34.pt and fine-tuned for 10 epochs at lr 2e-5 on the local RTX 4070. At inference time, dropout stays active and 20 stochastic forward passes produce a per-pixel mean prediction, predictive entropy (total uncertainty), and mutual information (epistemic uncertainty isolated from data noise).
| Result | Value |
|---|---|
| Validation mIoU (vs deterministic 0.8357) | 0.8134 (−2.7 %) |
| Test mIoU (vs deterministic 0.8456) | 0.8181 (−3.3 %) |
| ECE across 46 M validation pixels | 0.0072 |
| Mean mutual info on synthetic val (in-domain) | 0.041 |
| Mean mutual info on real moon photos (OOD) | 0.192 (4.7× lift) |
The accuracy cost is a small ~3 % mIoU drop. The calibration result is the headline: Expected Calibration Error of 0.0072 across 46 million validation pixels. When the model says it’s 99 % confident about a pixel, it’s right 99.3 % of the time. When it says 80 %, it’s right 87 %. When it says 70 %, it’s right 72 %. Across 15 confidence bins the curve sits almost on the perfect-calibration diagonal. Anything under 1 % ECE is considered exceptional in segmentation literature; 0.72 % is genuinely usable as-is for downstream confidence-weighted decisions.
The operationally more important number is the OOD lift. On synthetic validation (in-domain), per-image mutual information averages 0.041. On the 72 real moon photographs the model never trained on, per-image mutual information averages 0.192 — 4.7× higher. Predictive entropy shows a similar 3.3× lift. The model knows when it’s looking at something unfamiliar and emits measurably higher uncertainty instead of being confidently wrong.
For a landing-site application, that’s the difference between “here’s a green flag” and “here’s a green flag with low confidence — route to a human.” The MC Dropout mode is wired into the Streamlit demo upload box: drag in any image and you get the mean prediction plus an entropy heatmap and a mutual-information heatmap.
Cross-instrument PSR validation against ShadowCam at Cabeus / LCROSS
LunarSite’s PSR features — psr_fraction and illumination_min_pct — come from PGDA Product 69 (Mazarico et al. 2011, Icarus), which derives average solar visibility from LOLA topography and ten years of simulated sun positions. It’s the peer-reviewed PSR source NASA and most landing-site studies use, but it’s also a predicted map. The natural follow-up question is: does it agree with what an actual instrument sees?
ShadowCam is a NASA imaging instrument on Korea’s KPLO orbiter, designed specifically to image inside permanently shadowed regions using secondary illumination scattered from surrounding crater walls. It’s 200× more sensitive than LROC NAC. Caleb Fassett’s 2024 archive of ShadowCam imagery at the Cabeus / LCROSS impact site is publicly available on Zenodo (DOI 10.5281/zenodo.11175455, CC BY 4.0, 10.3 GB).
The two signals measure different physics. PGDA reports the time fraction during which direct sunlight reaches each pixel. ShadowCam composites integrate observed scattered radiance from secondary light. They cannot pixel-for-pixel correlate — that’s a feature, not a bug. The right validation question is: do both instruments converge on the same deep-shadow regions?
I downloaded the archive, extracted the ShadowCam composites for Cabeus, reprojected onto the PGDA grid, and computed agreement on the deepest-shadow pixels (bottom 25 % of secondary radiance, ShadowCam side; below 0.5 % direct illumination, PGDA side):
| ShadowCam composite | PGDA-predicted PSR fraction (this region) | % of ShadowCam deepest-shadow pixels inside PGDA PSR | n |
|---|---|---|---|
| topillum-avg | 82.7 % | 85.1 % | 7,448 px |
| bottomillum-avg | 86.1 % | 81.5 % | 9,204 px |
81–85 % of ShadowCam’s deepest-observed-shadow pixels at Cabeus fall inside PGDA-predicted PSRs. Both instruments converge on the same deep-shadow geography despite measuring fundamentally different physical signals — PGDA via geometry simulation, ShadowCam via direct observation of secondary-light radiance. This is exactly the kind of cross-instrument independent agreement that turns a single-source feature into a credible one. The PGDA-derived PSR features in Stage 3 are not just “a model trusts a model” — they have empirical backing from real imagery.
Honest scope cuts: what I deliberately didn’t do
The original Layer 3 plan was much broader than what shipped. Some of the items I started, prototyped, then explicitly cut. I think being open about why is more useful than pretending the scope was always this clean.
- Shadow-from-depth physics validation against LOLA. The math (depth = shadow_length × tan(sun_elevation)) is sound and the wrapper exists in the repo, but validating it against LOLA at scale would have added a week and produced a result whose value is mostly “the physics works,” not “LunarSite’s scoring is better.” The cross-instrument PSR validation already does the load-bearing work for the dark-terrain credibility argument.
- HORUS dark-image enhancement validation. Same archive (Fassett 2024) has 19 GB of raw ShadowCam cubes that would let you validate the HORUS-style denoiser scaffolded in the repo. Real research effort; uncertain credibility gain over the cross-instrument result already in hand. Cut.
- LuSNAR supplementary training data integration. 108 GB of additional five-class lunar segmentation data exists at HuggingFace
JeremyLuo/LuSNAR. Probably moves the test mIoU a point or two with another two weeks of work. Diminishing return at this scale. - DINOv2 encoder revisit. The original spec called for trying a DINOv2 encoder as a possible v3. The ResNet-34 baseline was strong enough that the case for the swap was speculative; the deep ensemble + MC Dropout work delivered better marginal value with less risk.
- arXiv paper. The novel contributions are real (PSR-aware site scoring with cross-instrument validation, calibrated MC Dropout for terrain segmentation with measured OOD lift, sim-to-real fine-tune closing the DeepMoon→LOLA crater gap), but writing a paper is a different sprint with a different audience than building the pipeline. Deferred.
None of these cuts changed the headline result. The final pipeline is exactly the one in the “pipeline at a glance” section: three stages, end-to-end, with all the validations described above. Adding HORUS or LuSNAR would have moved a number; not having them doesn’t change the story.
Try it, fork it, cite it
Everything is open source under MIT and reproducible from a single clone:
| Surface | Link |
|---|---|
| Live interactive demo | lunarsite.streamlit.app |
| Source code (MIT) | github.com/AlanSEncinas/LunarSite |
| Trained weights (9 checkpoints) | kaggle.com/datasets/encinas88/lunarsite-weights |
| Stage 1 fine-tune training data | kaggle.com/datasets/encinas88/lunarsite-southpole-finetune |
| Getting-started notebook | kaggle.com/code/encinas88/lunarsite-getting-started |
One-command end-to-end pipeline:
git clone https://github.com/AlanSEncinas/LunarSite.git
cd LunarSite
pip install -r requirements.txt
pip install -e .
python scripts/run_pipeline.py   # Stage 1 -> Stage 3 -> demo assets
~5 min on GPU, ~30 min CPU-only.
If LunarSite is useful in your own work:
Encinas, A. (2026). LunarSite — end-to-end ML pipeline
for lunar south pole landing site selection.
https://github.com/AlanSEncinas/LunarSite
Project built solo by Alan Scott Encinas. Questions, issues, or interested in adapting any of this to a real flight programme — reach me at alanscottencinas.com or via the GitHub issue tracker.
LunarSite is open source under the MIT License. Project finalized 2026-05-11.