LunarSite: An ML Pipeline for Lunar Landing Site Selection
Stage 2 case study — terrain segmentation with sim-to-real transfer from synthetic training data
I built a U-Net + ResNet-34 model that classifies lunar surface imagery into four hazard classes (background, small rocks, large rocks, sky). Trained exclusively on 9,766 synthetic Unreal Engine lunar scenes, it achieves 0.8456 test mIoU and transfers coherently to real Apollo/rover photography with zero domain adaptation. This is the first shipped stage of LunarSite, an open-source ML pipeline for lunar south pole landing site selection.
Live demo: https://lunarsite.streamlit.app
Code: https://github.com/AlanSEncinas/LunarSite
Author: Alan Scott Encinas
Why this project exists
On March 6, 2025, Intuitive Machines’ IM-2 mission crashed at the lunar south pole. The lander tipped on landing — the same failure mode that ended IM-1 a year earlier. Both were commercial lunar missions flying on NASA’s CLPS program, and both failed under the extreme lighting conditions of the south polar region where the sun barely clears the horizon and shadows stretch for kilometers.
The technical consensus after IM-2 was blunt: classical geometric hazard detection algorithms, which work well in equatorial lighting, struggle in polar conditions. Shadows get classified as holes. Bright rock surfaces get classified as flat terrain. The SPLICE flight system NASA developed for Artemis is deterministic and designed to work in real time during descent — it’s not the right tool for broad pre-mission analysis across thousands of candidate landing sites.
There is a gap here. NASA has operational flight-grade tools for descent. Academic researchers have published machine learning approaches for specific subtasks (crater detection, hazard classification, shadow segmentation). But there is no open, end-to-end ML pipeline that a commercial lunar company can point at the south pole, get a ranked list of safe landing sites, and understand why the model ranked them that way.
LunarSite is my attempt to fill that gap as a solo developer. I’m not NASA. I can’t out-compute JPL. But the pre-mission analysis layer is underserved, and solo developers with Kaggle GPU credits and stubbornness can contribute something useful.
This case study covers Stage 2 — the terrain hazard segmentation component — which is the first of three stages to ship. Stage 1 (crater detection) and Stage 3 (XGBoost site scorer with SHAP explainability) are in the roadmap.
The three-stage architecture
LunarSite is designed as a three-stage pipeline where each stage can be trained independently and their outputs are combined for final site ranking:
- Stage 1 — Crater Detection: U-Net on LOLA DEM tiles outputs crater masks and position/radius lists. Feeds
crater_density,crater_min_dist, andavg_crater_radiusinto Stage 3. - Stage 2 — Terrain Hazard Segmentation (this case study): U-Net on RGB lunar imagery outputs per-pixel classification into background, small rocks, large rocks, and sky. Feeds
rock_coverage_pct,large_rock_count, andshadow_coverage_pctinto Stage 3. - Stage 3 — Site Scorer: XGBoost on a feature matrix combining Stages 1 and 2 outputs with LOLA-derived features (slope, elevation, roughness, illumination). Rule-based pseudo-labels from NASA CASSA thresholds. SHAP for explainability.
The full architecture is described in the repository README. This case study focuses on Stage 2 because that’s what currently exists and because the sim-to-real transfer finding turned out to be the most interesting result.
The data
Primary training data: the Artificial Lunar Rocky Landscape Dataset by Romain Pessia on Kaggle. This is a synthetic dataset of 9,766 photorealistic lunar scenes rendered in Unreal Engine, each paired with a pixel-accurate ground truth mask labeling four classes:
- background — lunar regolith (the baseline surface)
- small_rocks — pebbles and small boulders (a few cm to a meter scale)
- large_rocks — boulders (meter-scale, landing-hazard-relevant)
- sky — the dark space above the horizon
The dataset is heavily imbalanced. On the training split:
| Class | Pixel frequency |
|---|---|
| background | 76.4% |
| small_rocks | 19.0% |
| large_rocks | 2.5% |
| sky | 2.1% |
Class imbalance matters because the rare classes (large_rocks, sky) are the most important for landing site decisions. A model that’s great at background and small_rocks but bad at large_rocks is dangerous — large rocks are what break landing legs.
Real validation data: the same Kaggle dataset also includes 36 real moon photographs (with 36 paired ground truth masks, which I discovered the hard way when the filenames collided on my first inference pass). These are Apollo/rover-era images with visible lunar terrain. I use them for qualitative sim-to-real evaluation — checking whether a model trained on synthetic Unreal Engine scenes actually produces coherent predictions on real lunar photography.
The training/validation/test split is deterministic: 80% train, 10% val, 10% test via np.random.RandomState(42).permutation(n). Same split across all experiments so numbers are directly comparable.
v1: the baseline approach
Config:
- U-Net from
segmentation_models_pytorch - ResNet-34 encoder pretrained on ImageNet
- Dice + Cross-Entropy loss (50/50 mix)
- AdamW optimizer with cosine annealing schedule
- 50 epochs at 480×480 input resolution
- Standard augmentations (horizontal flip, rotation, random brightness/contrast) plus three custom lunar-specific transforms: shadow rotation, extreme contrast, and Hapke BRDF perturbation
- Trained on A100 (Google Colab) initially, later reproduced on Kaggle T4×2
v1 test results:
| Metric | Value |
|---|---|
| Test mean IoU | 0.8425 |
| Test mean Dice | 0.9089 |
| Background IoU | 0.9754 |
| Small rocks IoU | 0.9748 |
| Large rocks IoU | 0.7092 |
| Sky IoU | 0.7104 |
The pattern is what you’d expect: the model is excellent at the common classes (background and small_rocks both ~0.975) and noticeably worse at the rare classes (large_rocks and sky both ~0.71). The 25-point gap between common and rare classes is the intrinsic difficulty of imbalanced multi-class segmentation.
On an imbalanced 4-class dataset like this, a 0.8425 mean IoU is in the upper range of what’s achievable with standard U-Net approaches. Published baselines on this specific dataset typically land in the 0.70–0.80 range with basic U-Net, and 0.82–0.85 with well-tuned variants. My v1 is solidly in the well-tuned range.
v2: the hypothesis that didn’t work
v1’s large_rocks and sky IoU at ~0.71 felt like the obvious place to push. The natural hypothesis: if the rare classes are underperforming because the loss treats all classes equally, then explicitly rebalancing the loss toward rare classes should improve their IoU.
v2 config changes:
- Switched encoder from ResNet-34 to ResNet-50 (more capacity for hard features)
- Replaced Dice+CE loss with Focal Loss (gamma=2) + Dice
- Added inverse-frequency class weights to the focal loss (sky: 2.04, large_rocks: 1.68, small_rocks: 0.22, background: 0.06)
- Same everything else (data split, augmentations, optimizer schedule, input resolution, epochs)
The hypothesis: focal loss down-weights easy examples (background pixels), class weights further boost the rare classes, and the deeper ResNet-50 encoder has more capacity to learn the harder rare-class features. Together, this should push large_rocks and sky IoU up without hurting the common classes much.
v2 test results (with flip TTA, head-to-head against v1 with flip TTA):
| Class | v1 (ResNet-34 + Dice+CE) | v2 (ResNet-50 + Focal + weights) | Delta |
|---|---|---|---|
| background | 0.9759 | 0.9740 | −0.0019 |
| small_rocks | 0.9749 | 0.9689 | −0.0060 |
| large_rocks | 0.7176 | 0.7240 | +0.0064 |
| sky | 0.7141 | 0.7047 | −0.0094 |
| Mean IoU | 0.8456 | 0.8429 | −0.0027 |
v2 did exactly what the hypothesis predicted, and it wasn’t enough.
The focal loss + class weights combination successfully boosted large_rocks IoU by 0.64 points (0.7176 → 0.7240). That’s a real improvement on the target class. But it came at the cost of every other class — background lost 0.19 points, small_rocks lost 0.60 points, sky also lost 0.94 points (despite being one of the rare classes that was supposed to benefit).
The net effect: v2 lost to v1 by 0.0027 mean IoU. Within noise, but consistently worse across TTA configurations.
Why v2 lost
The likely failure mode: on a dataset where 95% of pixels are in the two common classes (background + small_rocks = 76% + 19%), even a small degradation on the common classes outweighs a reasonable gain on the rare classes in terms of mean IoU. The rebalancing trade-off isn’t favorable because the common classes carry too much of the total.
Two other explanations that might contribute:
- Batch size reduction. ResNet-50 requires more VRAM than ResNet-34, so I had to drop batch size from 16 (v1 on A100) to 6 (v2 on Kaggle T4×2). Smaller effective batch size means noisier batch normalization, which can cap final model quality. I can’t fully disentangle this from the loss-change effect without a controlled ablation.
- Sky class is fragile. The sky class can appear in very different visual contexts — sometimes as a clear upper region of an image, sometimes as thin bands near the horizon, sometimes not at all. Focal loss is known to be sensitive to difficult examples that are intrinsically ambiguous, and sky might be hitting that regime. A model with more capacity might actually over-fit to the ambiguous sky examples during training and lose generalization on the test set.
The honest takeaway
The v2 experiment is a documented negative result. I ran it, it didn’t work, and I can explain why. The v1 config (U-Net + ResNet-34 + Dice+CE) is the locked production model.
Negative results are worth publishing. In portfolio projects (and in ML research more broadly), there is a strong bias toward only showing things that worked. That bias is a problem because it hides the decision-making story — the part where a practitioner looks at a result, forms a hypothesis, tests it, and either ships the new approach or reverts to the baseline with knowledge of why.
I’m keeping v2 in the repository and this case study because someone evaluating LunarSite (hiring manager, commercial lunar company, researcher) should be able to see that I test hypotheses, measure outcomes, and revert when the data says revert. That’s a more valuable signal than “everything I tried worked.”
Test-time augmentation: flip helps, multi-scale hurts
I also ran a full TTA analysis on both v1 and v2. The question: does averaging predictions across augmented versions of the test input at inference time improve mIoU enough to justify the extra compute?
I tested three eval modes on both models:
- Standard — single forward pass, no augmentation
- Flip TTA — 4-way averaging: identity + horizontal flip + vertical flip + both flips
- Multi-scale TTA — 12-way averaging: 3 input scales (0.75×, 1.0×, 1.25×) × 4 flips
Results:
| Model | Standard | + Flip TTA | + Multi-scale TTA | Inference (ms/image) |
|---|---|---|---|---|
| v1 ResNet-34 | 0.8425 | 0.8456 | 0.8439 | 48.8 / 64.0 / 231.0 |
| v2 ResNet-50 | 0.8390 | 0.8429 | 0.8409 | 41.3 / 111.2 / 356.2 |
Two clear findings:
1. Flip TTA is free money. It adds ~0.003 mIoU on both models (+0.3 pts) at the cost of 15–70 ms per image. Always use it in production.
2. Multi-scale TTA actively hurts. On both models, adding multi-scale decreased mean IoU compared to flip-only TTA, and it tripled inference time (64 ms → 231 ms on v1, 111 ms → 356 ms on v2). This was a surprising result. My hypothesis: the U-Net’s skip connections encode features at specific spatial resolutions that don’t transfer cleanly across scale changes, so the downsampled and upsampled predictions disagree with each other in a way that drags the average down. Whatever the exact cause, the data clearly says skip multi-scale.
Production inference pipeline: flip-only TTA, no multi-scale.
Sim-to-real: the actually interesting result
Here’s where it gets fun. The Kaggle dataset includes 36 real moon photographs for qualitative validation. I ran v1 inference on all 36 with zero fine-tuning, no domain adaptation, no real-data training — just loaded the synthetic-trained checkpoint and ran it on real lunar photography.
What the class coverage distribution looks like on real moon data:
| Class | Synthetic training distribution | Real moon inference |
|---|---|---|
| background | 76.4% | 74.9% |
| small_rocks | 19.0% | 19.1% |
| large_rocks | 2.5% | 1.4% |
| sky | 2.1% | 4.6% |
Background and small_rocks are within 2 percentage points of their training distribution. That’s a strong signal: the model’s overall prior over classes transferred. It’s not collapsing to one class, not spraying random predictions, not failing catastrophically. It’s producing the same rough class balance on real moon data as on synthetic data.
Large_rocks undershoots on real data (1.4% vs 2.5%) and sky overshoots (4.6% vs 2.1%). Both make sense: many real lunar surface photos are long-range landscape shots where large boulders are relatively rare, and the real images that do include sky tend to show more of it than the synthetic scenes where sky is often clipped by the camera framing.
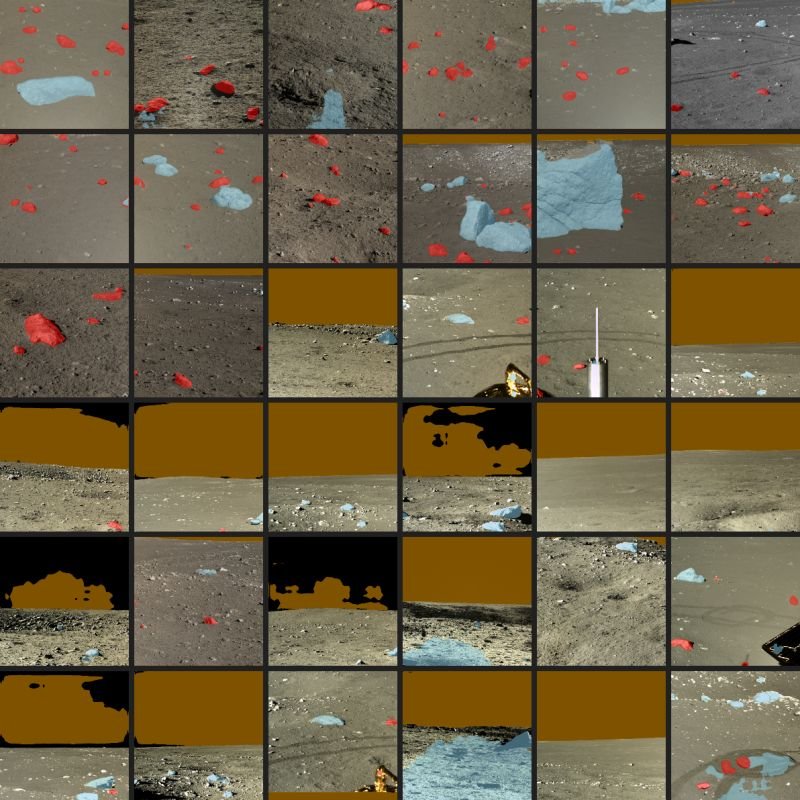
Visual inspection on a 6×6 contact sheet (see demo_assets/contact_sheet.png in the repository) shows:
- Red (large_rocks) overlays landing on actual boulders and surface rocks
- Blue (sky) overlays correctly placed in the upper portions of shots that have visible sky
- Orange (small_rocks) overlays on textured rubble areas
- Unmodified gray/brown (background) on flat regolith
Failure mode: bright white sun-lit rocks occasionally misclassified as sky. The synthetic training set has bright, uniform sky in every frame, so the model has learned a “bright and uniform” shortcut that fires on sun-lit boulders. This is visible in a handful of the 36 examples where light-colored rocks show blue overlay. It’s an interpretable failure — not a mystery — and it suggests the fix is to add sim-to-real augmentations that break the bright/uniform shortcut, or to fine-tune on a small amount of real lunar imagery.
Why sim-to-real matters for this project
The practical problem: there is no large labeled dataset of real lunar imagery with pixel-level hazard classes. NASA has imagery (LRO NAC, ShadowCam, Apollo archives). They do not have tens of thousands of pixel-annotated hazard masks. Any ML-based lunar terrain tool either has to work with a tiny labeled real dataset (insufficient for training deep models from scratch), generate synthetic training data and pray it transfers (the sim-to-real gap problem), or use domain adaptation techniques to bridge the gap.
LunarSite is currently in the “generate synthetic and pray it transfers” category. The finding that it transfers coherently (with one interpretable failure mode) on a held-out set of real moon images is the minimum viable evidence that this approach works. It’s not flight-grade validation — you’d need order-of-magnitude more real imagery and proper IoU scoring against real ground truth. But it’s enough to justify continuing down this path rather than abandoning synthetic training and starting over with a different data strategy.
What I’m shipping with Stage 2
Production config (locked):
- U-Net + ResNet-34 encoder pretrained on ImageNet
- Dice + Cross-Entropy loss, no class weights
- AdamW optimizer, cosine annealing, 50 epochs, 480×480 input
- Flip-only test-time augmentation at inference (no multi-scale)
- Checkpoint:
best_resnet34.pt
Test performance:
- Mean IoU: 0.8456
- Per-class IoU: background 0.9759, small_rocks 0.9749, large_rocks 0.7176, sky 0.7141
- Inference time: ~64 ms/image on CPU with flip TTA
Sim-to-real evidence:
- 36 real moon photos evaluated, class distribution within 2pp of training distribution
- Known failure mode documented (bright-rocks-as-sky)
Demo: https://lunarsite.streamlit.app
Source: github.com/AlanSEncinas/LunarSite
Preloaded real-moon examples + synthetic benchmark + upload box. Full training notebooks, eval notebook, and sim-to-real script reproduce every number in this case study.
What I learned
1. Negative results are load-bearing. The v2 experiment not working taught me more about the dataset than the v1 experiment working. Specifically: the dataset’s class imbalance is too severe for loss rebalancing to be a net win, because the common classes dominate the mean mIoU metric. Next time I approach a similar problem, I’ll be more skeptical of “rebalance the loss” as a default intervention and more interested in either adjusting the metric (weighted mIoU) or improving data quality on the rare classes.
2. TTA is not a free win across the board. Multi-scale TTA’s failure was genuinely surprising — every blog post I’ve read on TTA treats it as a universal lift. The failure mode is consistent with U-Net’s skip-connection architecture, but I wouldn’t have known without running the experiment. Lesson: always measure, don’t assume.
3. Sim-to-real transfer can be evaluated cheaply and qualitatively. You don’t need a labeled real dataset to get signal on whether a synthetic-trained model is working. Running inference on a small set of real images and checking the class coverage distribution + visual overlay is fast, cheap, and surprisingly informative. For projects without large real datasets (most domain-specific ML projects), this pattern is worth adopting earlier in the process.
4. Infrastructure compounds. The Kaggle automation I built to make training runs reproducible (a scripts/kaggle_run.py that pushes notebooks, polls status, and pulls outputs) paid for itself within one project cycle. When Stage 1 crater detection training begins, I’ll reuse the same infrastructure with a new kernel entry and zero browser clicks. This is the kind of invisible work that feels like procrastination during the session and like a gift from past-you in every future session.
What’s next
LunarSite has three build layers, each with a distinct role:
- Layer 1 — Foundation (complete): Stage 2 segmenter + sim-to-real eval + Streamlit v0 demo. What this case study covers. The core ML capability works and you can show it to someone.
- Layer 2 — Deepening (in progress): Layer 1 + deep ensemble uncertainty on Stage 2 + Stage 1 crater detection + Stage 3 XGBoost scorer with LOLA features + Streamlit v3 demo with coordinate input and SHAP explanation. This is the real ship — LunarSite as pitched.
- Layer 3 — Validation & End Game (post-ship): Dark terrain module for permanently shadowed regions, MC Dropout uncertainty, arXiv paper, commercial outreach to Intuitive Machines / Firefly / Astrobotic / ispace, community launch.
The immediate next technical step is deep ensemble training: 4–5 runs of the v1 config with varied random seeds for epistemic uncertainty estimation. That unlocks proper per-pixel confidence maps, which matter when the downstream site scorer needs to weigh hazard predictions by how sure the model is.
After ensemble, Stage 1 (crater detection) begins — a separate U-Net trained on DEM tiles to output crater masks. Then Stage 3 (XGBoost site scorer) brings everything together with LOLA geospatial features.
The roadmap is tracked publicly in the CLAUDE.md specification file in the repository.
Try it and let me know what breaks
- Live demo: https://lunarsite.streamlit.app — upload any lunar or lunar-ish image and see what the model predicts. Start with one of the preloaded real moon examples to see what the output looks like.
- Source code: github.com/AlanSEncinas/LunarSite — everything is MIT-licensed, reproducible, and documented. Pull requests and issues welcome.
- Contact: if you work at a commercial lunar company, academic lab, or space agency and this is relevant to something you’re building, I’d genuinely like to hear about it. Reach out via GitHub or LinkedIn.
If you’re a solo developer thinking about doing something ambitious in a domain you don’t work in professionally: the gap between “I have an idea” and “I shipped Layer 1” is much shorter than the institutional narrative makes it look. Four days of focused work got me from zero to a deployed interactive demo. The bottleneck was rarely technical capability — it was usually decision-making speed and willingness to ship something imperfect. If this case study is useful to anyone considering a similar project, that’s the single most important thing to internalize.